

You have probably come across the term RSI when researching stock analysis. Perhaps you saw a stock with an RSI below 30 and wondered if it was a buying opportunity. Before you proceed, it is important to understand what ‘oversold’ really means and whether it truly signals a good entry point.
What is the Relative Strength Index?
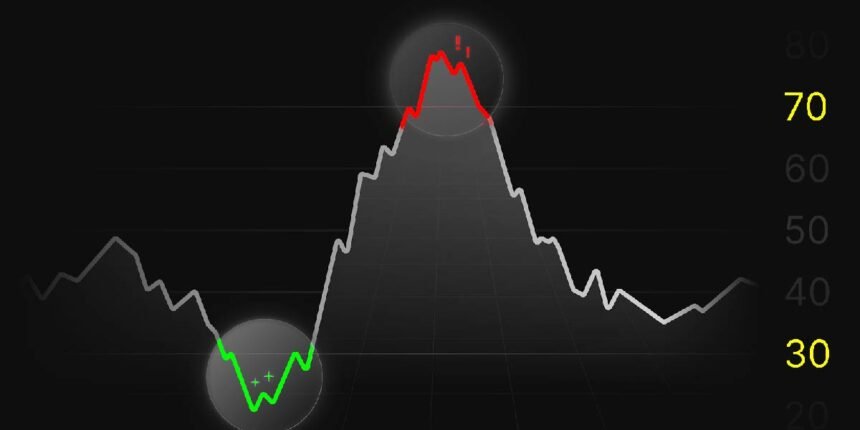
The Relative Strength Index (RSI) is a technical indicator in trading to gauge the strength or weakness of a stock’s price movement. RSI ranges from 0 to 100. Here, below 30 means oversold condition in the market, and above 70 means overbought.
The RSI calculates this by analysing the average gains and losses for a specific period, typically 14 days.
If the RSI is high, it suggests that the stock has experienced significant recent buying, and the price may decline soon. If the RSI is low, the stock may have been sold too much, and its price might rise.
Let’s say you are tracking a stock with an RSI of 70. This suggests it is overbought. You may decide to wait before buying it now, as a price drop could be on the way. But if another stock shows an RSI of 35, it could be a good chance to enter before the price recovers.
‘Oversold’ RSI Does Not Always Mean ‘Undervalued’
If you are considering oversold RSI stocks as a buying opportunity, remember that it does not always mean undervaluation. Here is why:
Only a Momentum Indicator
RSI only considers the speed and direction of price movement, disregarding the asset’s intrinsic value. An RSI below 30 shows that the asset has seen more intense recent selling than buying. It does not account for earnings, balance sheet health, debt levels, or future growth potential, which are core inputs in proper valuation.
Structural Weakness
Sometimes, a low RSI is because of underlying business deterioration, such as regulatory issues, collapsing margins, or unsustainable debt levels. These factors justify persistent selling pressure to show oversold conditions. However, in reality, the price may be adjusting to a new, more realistic valuation based on negative fundamentals rather than undervaluation.
Skips Macro-Economic Context
RSI does not factor in macroeconomic signals, such as interest rate hikes, inflationary pressure, geopolitical risk, or currency fluctuations. These factors can drag the entire market or sector lower regardless of individual RSI readings. In such scenarios, ‘oversold’ is a response to broader systemic risk and not the undervaluation of a specific asset.
Lag in Illiquid Stocks
If you observe illiquid stocks, you may notice that even minor price movements can trigger exaggerated RSI signals. This happens due to sparse trading activity. Such distortion makes the RSI less reliable, as it reacts to price sensitivity rather than genuine market interest.
Technical Breakdown
If a stock breaks key technical support levels, it may enter a price discovery phase where RSI remains low with no immediate floor. Traders focus more on broken support structures than the RSI levels. In this phase, even if the RSI suggests an oversold condition, the market may continue to price in worse-case scenarios.
News-Based Sell-Offs
In the short term, sharp drops due to news such as earnings misses, executive resignations, or lawsuits can push the RSI below 30. However, if the news signals deeper issues, prices may continue falling. The oversold RSI reflects the speed of the decline but not whether the news justifies a lower long-term valuation.
Ignores Broader Context
RSI works best when combined with trend analysis, candlestick patterns, and support and resistance zones. A low RSI in a strong downtrend without any reversal pattern, such as a hammer or bullish divergence, lacks confirmation. Relying solely on the RSI can lead you to wrongly assume that a drop in momentum means the asset is undervalued, which is not always a correct trading decision.
Conclusion
While RSI stocks can present buying opportunities, as a trader, you must conduct thorough fundamental and technical analysis before making investment decisions.
Consider using a free screener for stocks and other indicators. Keeping an eye on market sentiment and waiting for clear confirmation signals can help you reduce risks and improve your chances of better returns.
For More Information Visit Fourmagazine